Performance
Last updated: February 08, 2024
What information is shown here?
The performance overview displays summary metrics for all buildings within the account/folder, filtered by the selected map area or other filters accessible from the toolbar.
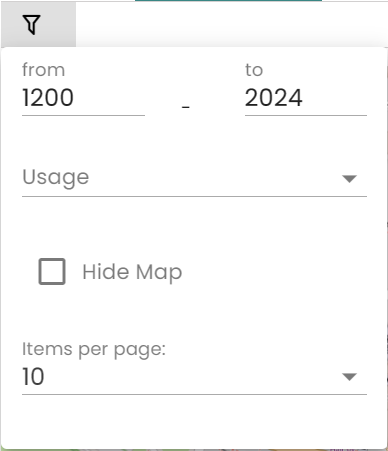
By default the performance is filtered on buildings delivered between 1200 and the running year. If the building does not have a delivery date set, it will not be shown on the map or be accounted for in the calculations. You can adjust the filters to your needs, but this is only for this viewing session and will not be remembered or inherited to other folders or views.
General Information
The total number of buildings (based on the filter) are displayed. The extra information of buildings, selection area and building data are calculated based on the buildings within the (filtered) map area selected at that time. If you select a different area in the map, these number s change accordingly.
Key Performance Indicators (KPIs)
Which KPIs are displayed depends on the user preferences, which can be edited under the Edit layout menu item under your profile photo at the top right of the browser.
By default, when no user preferences are set, the following KPIs are displayed:
- Mass by Material Family: shows the total mass per Material Family of all active buildings within the account.
- Mass; measures the total mass of the materials, as well as the intensity of materials used per m2.
- Circularity; measures the Madaster Circularity Indicator, which is based on the degree of non-virgin materials used during construction, their utility, and their potential for reuse & recycling at end of use. The MCI applies a penalty for unknown materials. The score shown is weighted by the total mass of each building within the account. Thus, buildings with high mass influence the score more than those with low mass.
- Detachability; measures the degree to which materials and products can be disassembled without being damaged. The score shown is weighted by the total mass of each building within the account. Thus, buildings with high mass influence the score more than those with low mass.
- Global Warming Potential (GWP); measures the equivalent CO2 emissions released during the production (A1-A3), installation (A4-A5), use (B1-B5), and disassembly (C1-C4) of a building. Since production data (A1-A3) is most commonly accessible within the construction industry, it is used to establish reliable totals that can be compared between accounts, folders, and buildings. The Global Warming Potential intensity for A1-A3 is also shown per m2.
- Net Present Value (NPV); measures the present monetary value of materials at their end of life, accounting for the costs of disassembly, transportation and processing for re-sale. The Net Present Value (NPV) is also shown per m2.
From all KPI’s, it is possible to navigate to the detail tabs Mass, Circularity, Environmental or Financial for more detailed information and comparison per building.